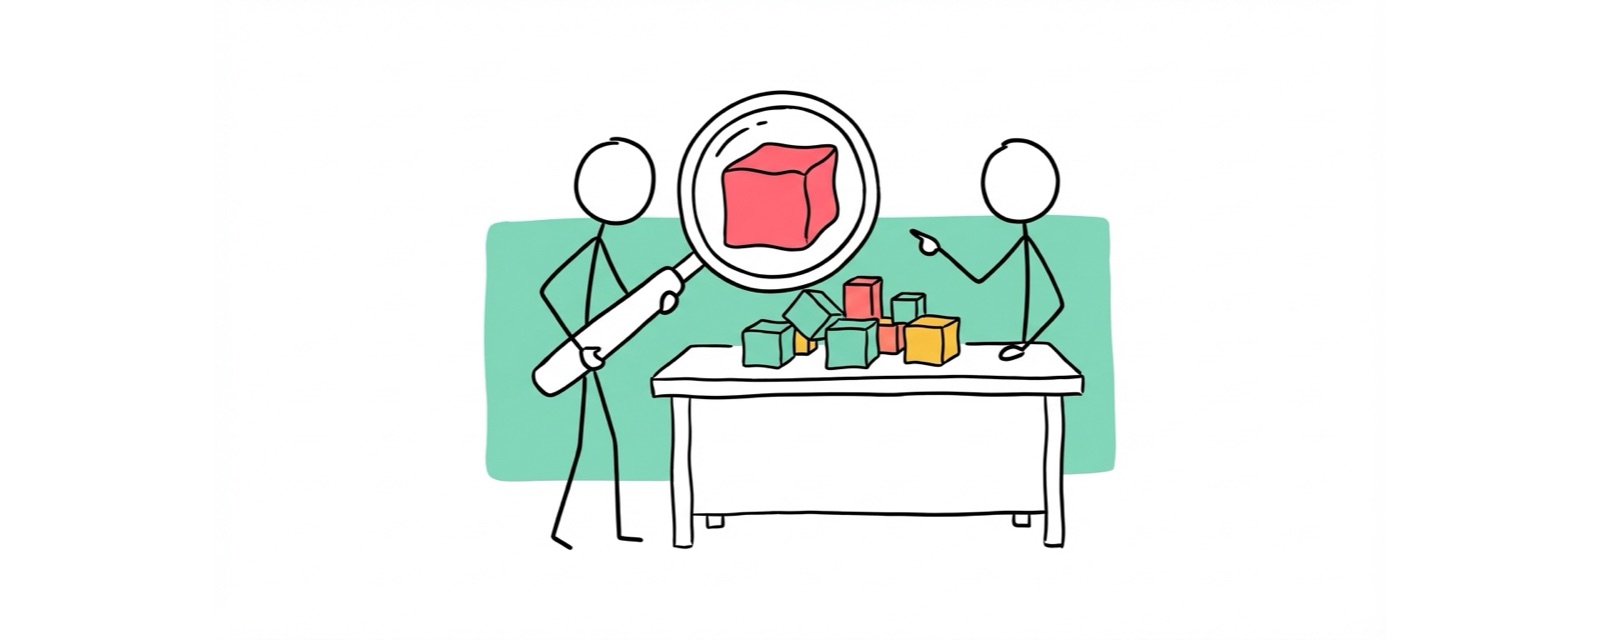
The software risks experiment
In this article we will look at an experiment the CodeBots team conducted to discover how we could best manage software risks.
After you learn how to propose an experiment, the next step is the fun part - running one! In this article we will look at an experiment the CodeBots team conducted to discover how we could best manage software risks. The experiment will follow the procedure outlined in the how do you propose an experiment article.
To give some context as to why we started this particular experiment; we had noticed our software teams were frequently overoptimistic with their project estimations. As we have later come to discover, this is not a problem unique to us. Time estimation academic, Magne Jørgensen, writes in his paper on Time Predictions Understanding and Avoiding Unrealism in Project Planning and Everyday Life, that humans (and particularly software engineers) are inherently overoptimistic of their abilities. He calls this the experience familiarity factor. To balance out this factor in our estimations, we started to experiment.
Step 1: Understand the problem
To better understand why our teams were underestimating the time it took to complete projects, we began investigating our historical project data. We used burn down charts to identify 100 issues that fell behind schedule, and interviewed our developers to get their honest opinion as to why they believed this occurred.
What we found were the common themes in their answers was the complexity of the issue and their familiarity with the solution. It seemed as though these were two risks that were not properly being accounted for when the developers made their project estimations.
Step 2: Develop a hypothesis
Our next step was to develop a hypothesis to test how we could create a more accurate method for estimating. Our assumption, based on researching the problem, was that developers were not accounting for their unfamiliarity with an issue, nor the complexity of it.
We therefore hypothesised if each issue could account for these two risks, it would result in estimates that came closer to the actual development time.
Our hypothesis could therefore more formally be summarised as: If we account for the technical complexity and a developer's unfamiliarity with an issue, then our estimations will be closer to reality, because we are considering two of the biggest issues that cause a developer to underestimate.
Step 3: Plan the experiment
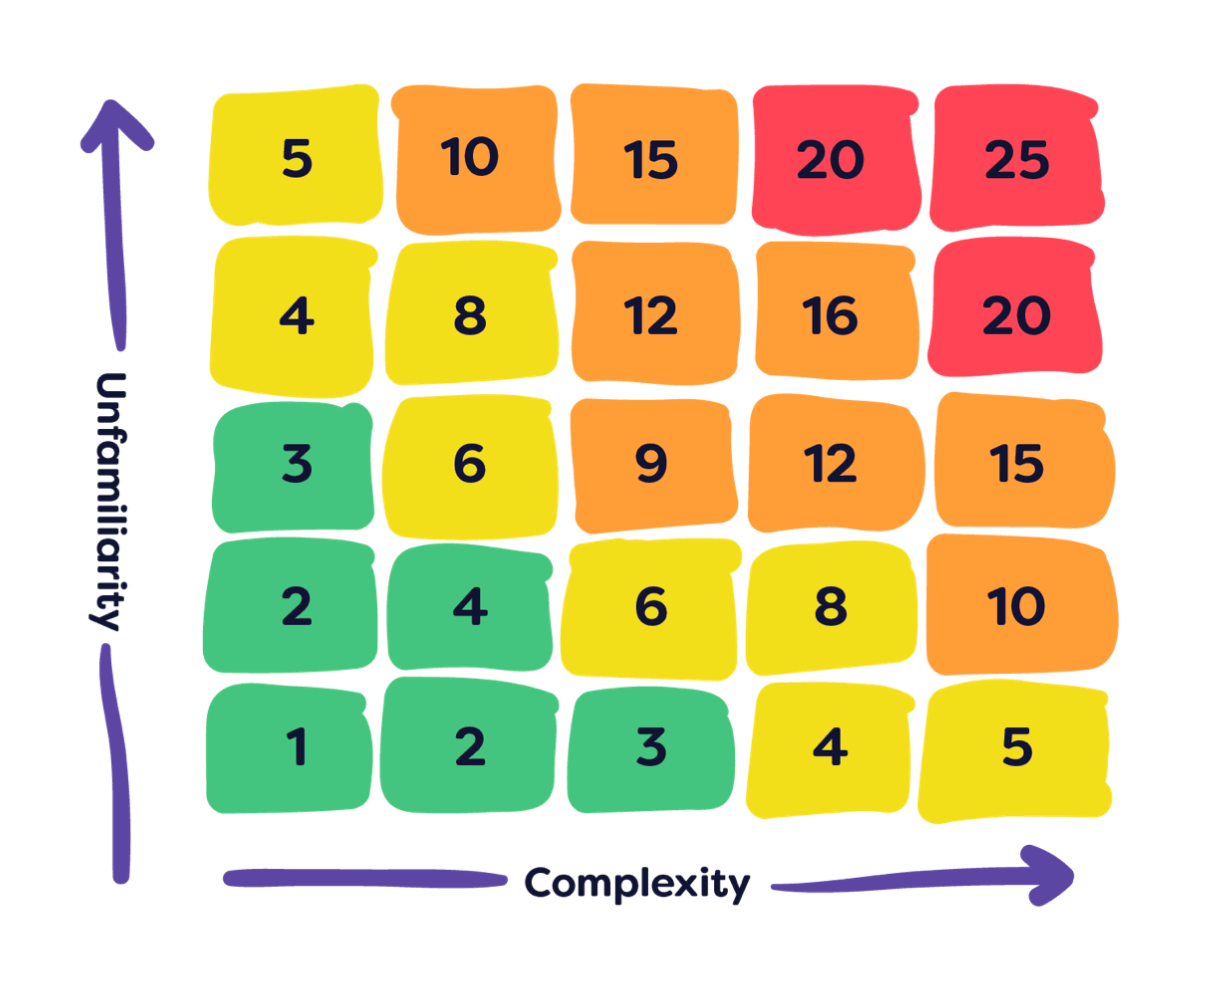
To plan the experiment, we had to create a solution that would allow us to test our hypothesis. This involved developing a tool to account for complexity and unfamiliarity in the estimation of every issue. This was how we created the risk matrix.
The risk matrix would determine a risk score for each project issue. Unfamiliarity was plotted against complexity on a matrix. A developer would identify on a scale of 1-5 the unfamiliarity, and again on a 1-5 for the technical complexity of each issue. The matrix would then produce a multiplier which could be applied against the developer's original estimate to create the new, more risk averse time estimate.
We would test this risk matrix on the next 100 project issues, so as to provide comparative data to our historical analysis. This would be run in actual projects by our development teams. Success would be determined, not if estimates were entirely accurate (as there is no such thing), but if the estimates were on average more accurate than previous data.
Step 4: Collect the data
From our original 100 issues, we compiled the average difference in time between the estimation and actual delivery time. We then compared this against the 100 issues we estimated and delivered using our risk matrix. The average difference between the two times decreased.
Step 5: Make a decision
The data showed us that the risk matrix helped us create more accurate project estimations. We have implemented this matrix across all project teams and since delivered a number of successful projects with this tool.
Future Work
The important thing to keep in mind is to continue to experiment, and iterate with any learnings you make from implementing your decision. When implementing the risk matrix in our projects, we noticed the issues which had higher numbers on the matrix were more unpredictable for estimations.
This led to a second experiment where we discovered risk scores above an 8 on the matrix were too difficult to estimate with any level of precision. In this experiment we began to test what we now call a tech spike. This is where a developer gets to discover more about the requirements of an issue before they have to estimate. You can read more in our article on the tech spike experiment.
Discover More
Turning Paths into Organisational Memory
CodeBots helps teams publish new paths into durable knowledge, so what works in one project can guide future work through Docs and ChatStudio.
Follow Golden Paths with ChatStudio
ChatStudio Path Explorer helps teams follow golden paths instead of starting from a blank prompt, turning reusable bot knowledge into guided, governed work.

Bring Your Own Keys to ChatStudio and Keep Control
ChatStudio BYOK lets teams use the AI providers their organisation already approves, discover models directly from those providers, and calibrate execution without giving up control.